Digital Director, Campaign Researcher — July 2016 to November 2016
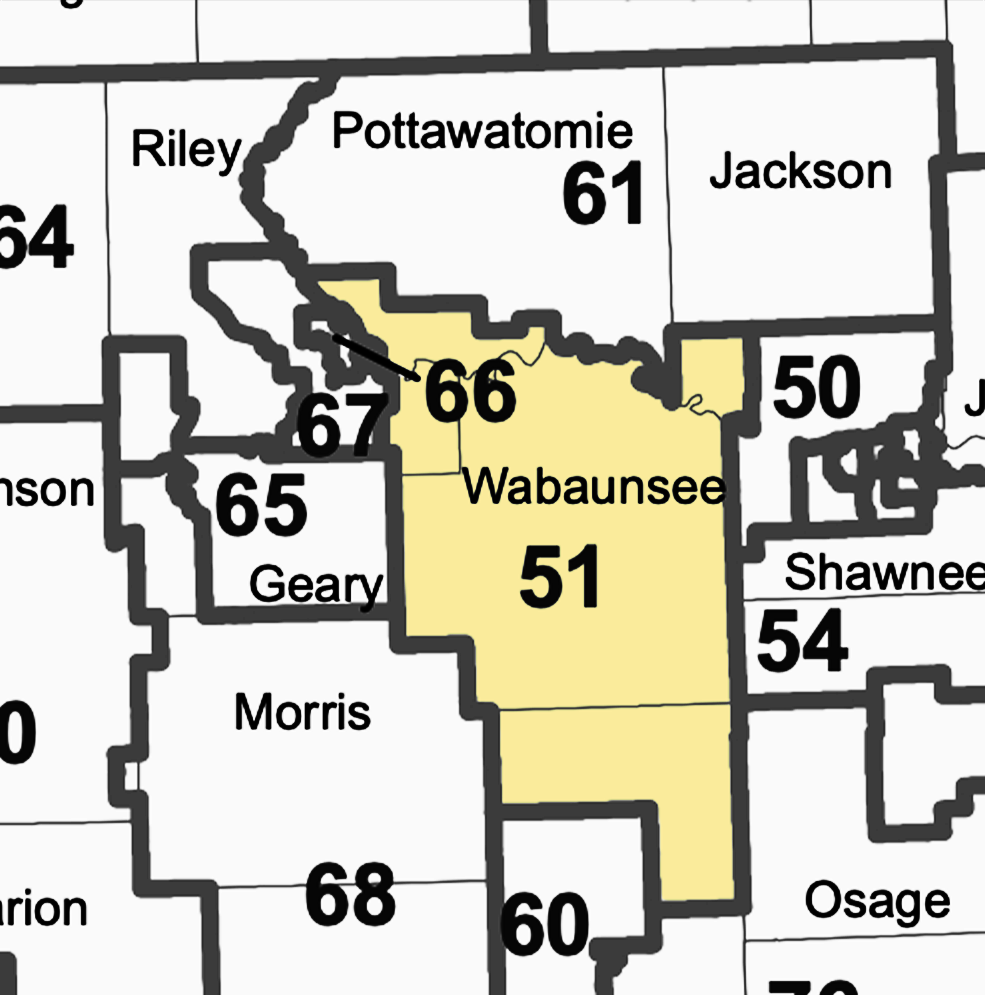
I handled digital communications and research for the 2016 Adrienne Olejnik campaign for Kansas’ 51st House District, an unexpectedly competitive race in a district Donald Trump won by a 44.5% margin with more raw votes than in any other state house district in Kansas.
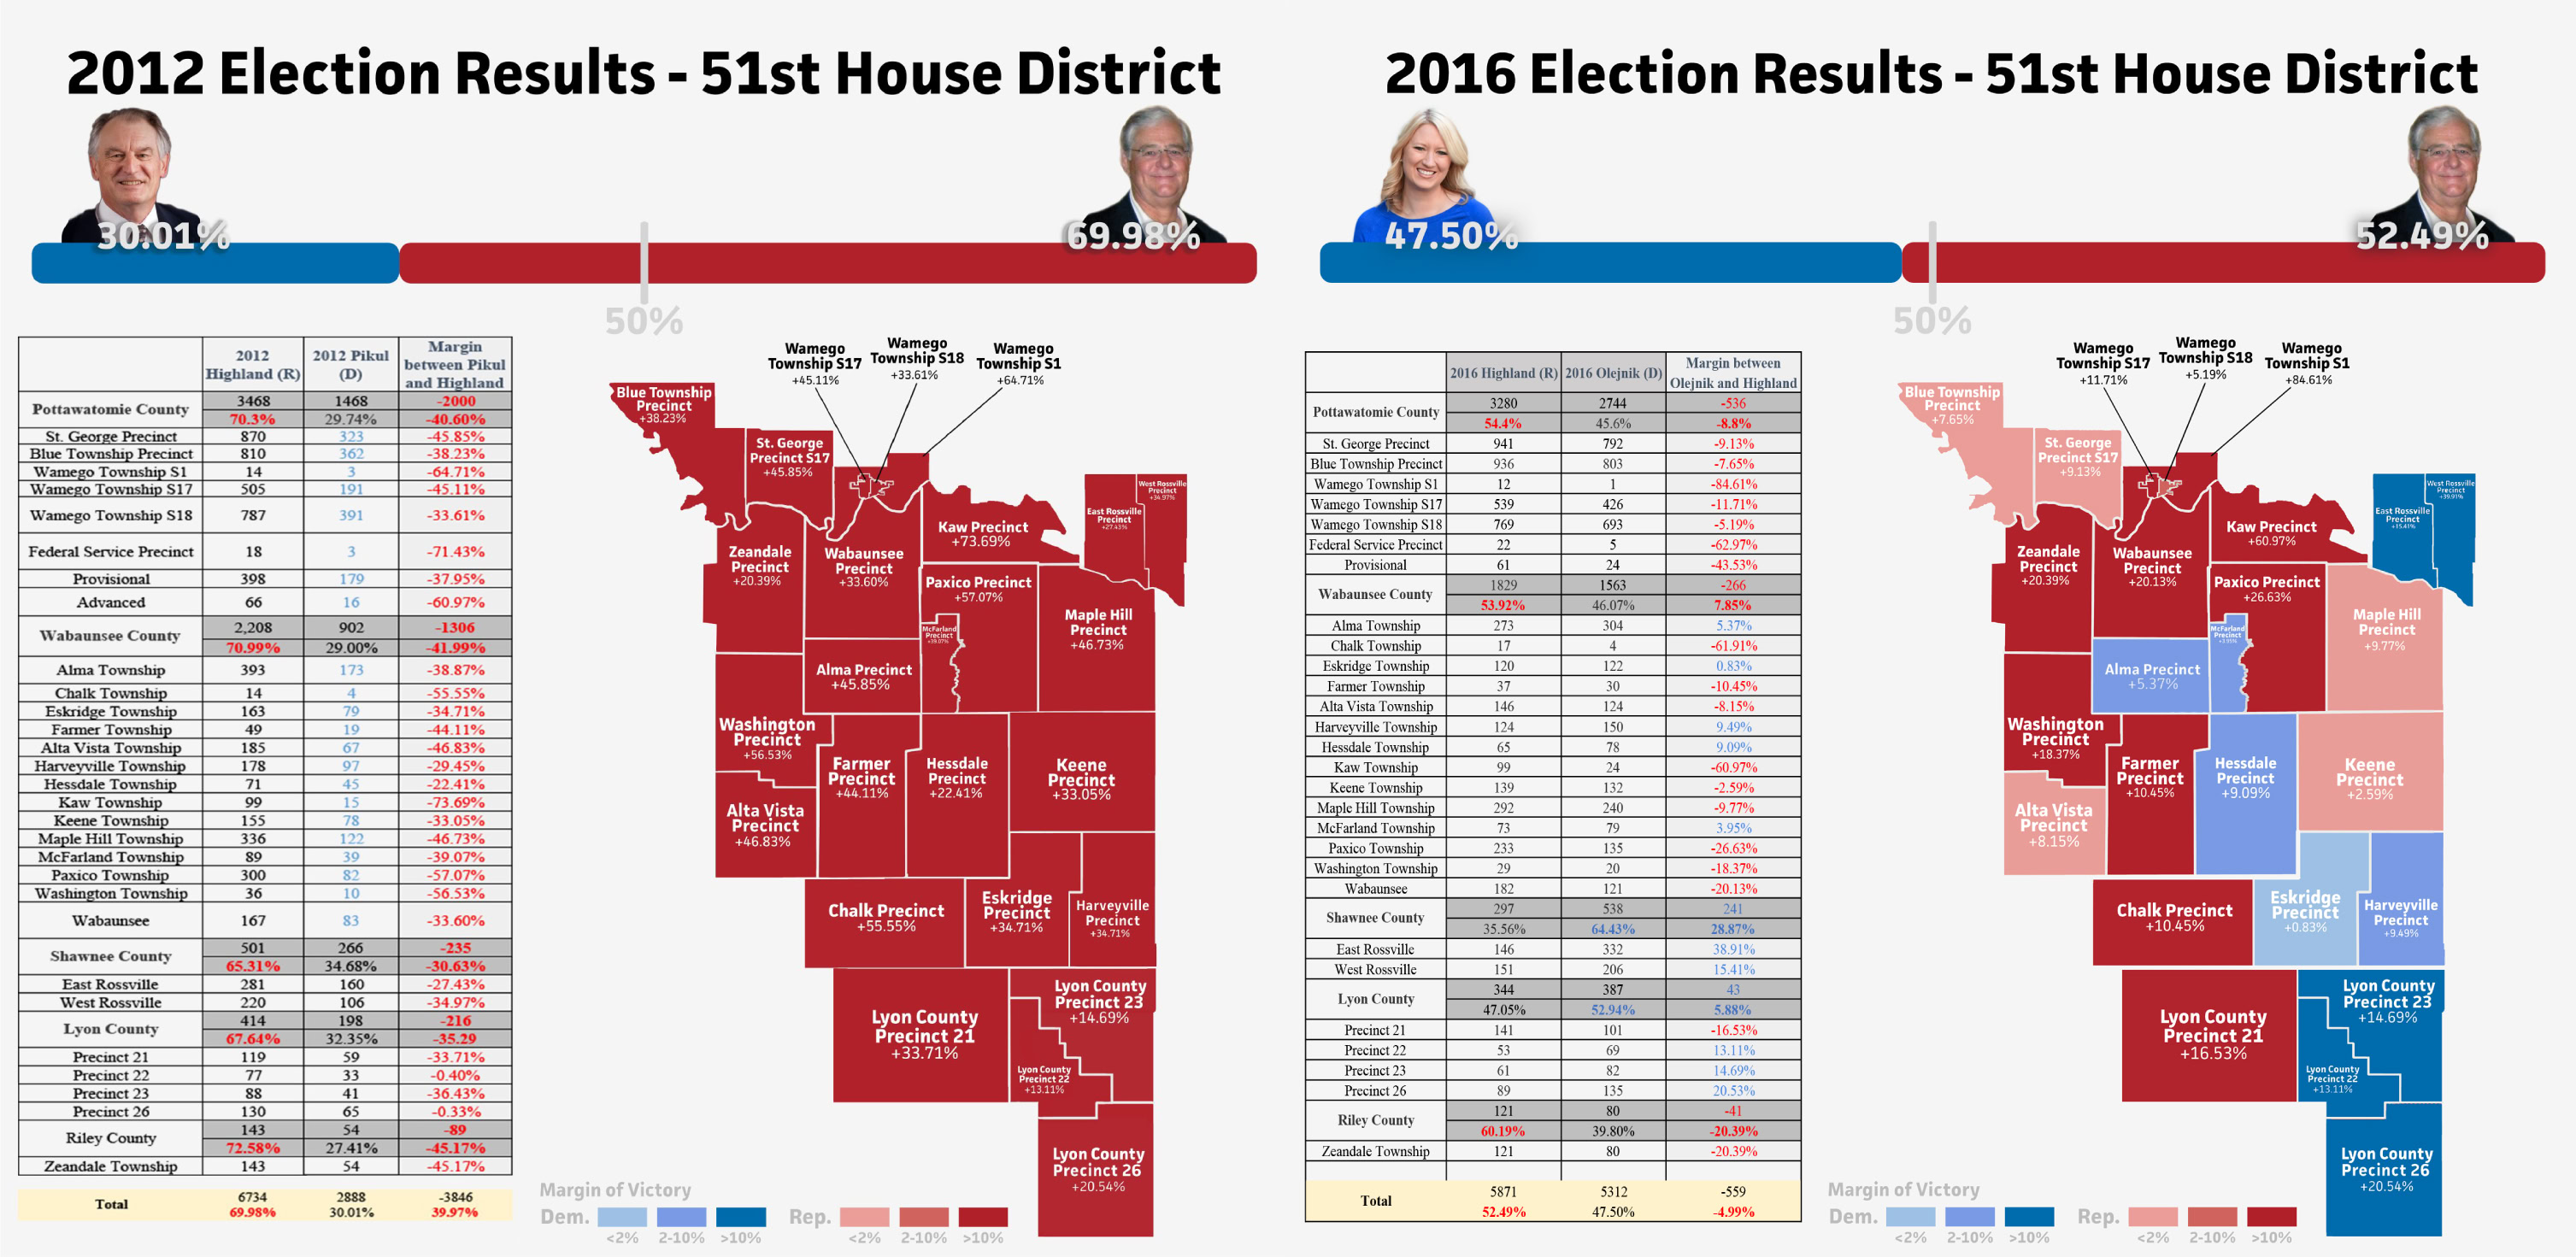
While our opponent won 51.9% to 48%, I was an integral part of a campaign which produced one of the best Democratic performances in the conservative area the district has broadly covered since the last victory in 1992 (which sent a Democrat to the state house with fewer votes than we garnered). See data below.
My multimedia productions and assistance within the campaign also contributed to the tenfold increase in reach of the campaign’s website, Facebook and Twitter platforms, and applicable print channels. I also produced online and print graphics, promotional videos, and conducted research for the Olejnik campaign and opposition research against the rival candidate.
Historical Election Results – 51st House District
- Democratic candidate last won in 1992
- 2016 Results: D 48.0% – 5,354; R 51.9% – 5,783 (+4.25%, +429)
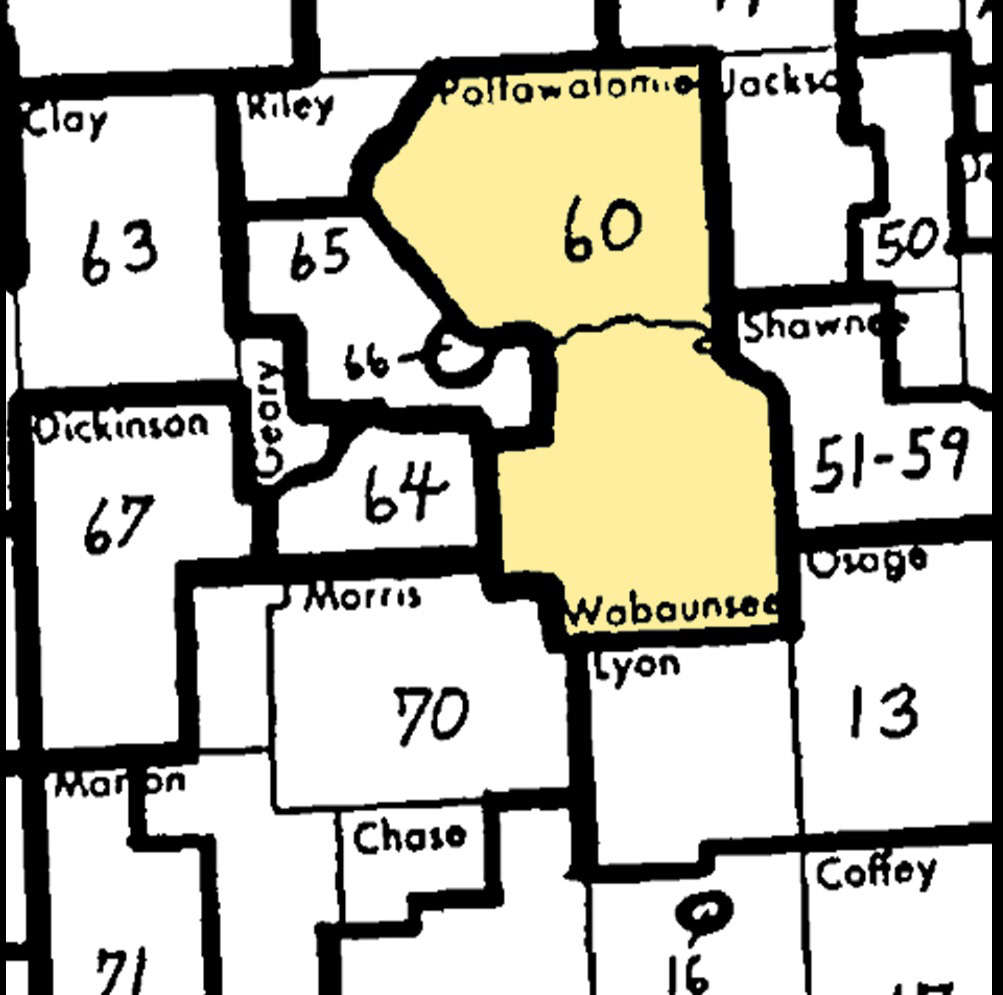
House District 60 Most Approximate
1972: R (R 99.79% – 6,312, Write-In 0.2% – 13)
1974: R (R 6,239)
1976: R (R 7,057)
1978: R (R, 6,499)
1980: R (D 40.09% – 3,194, R 59.90% – 4,773)
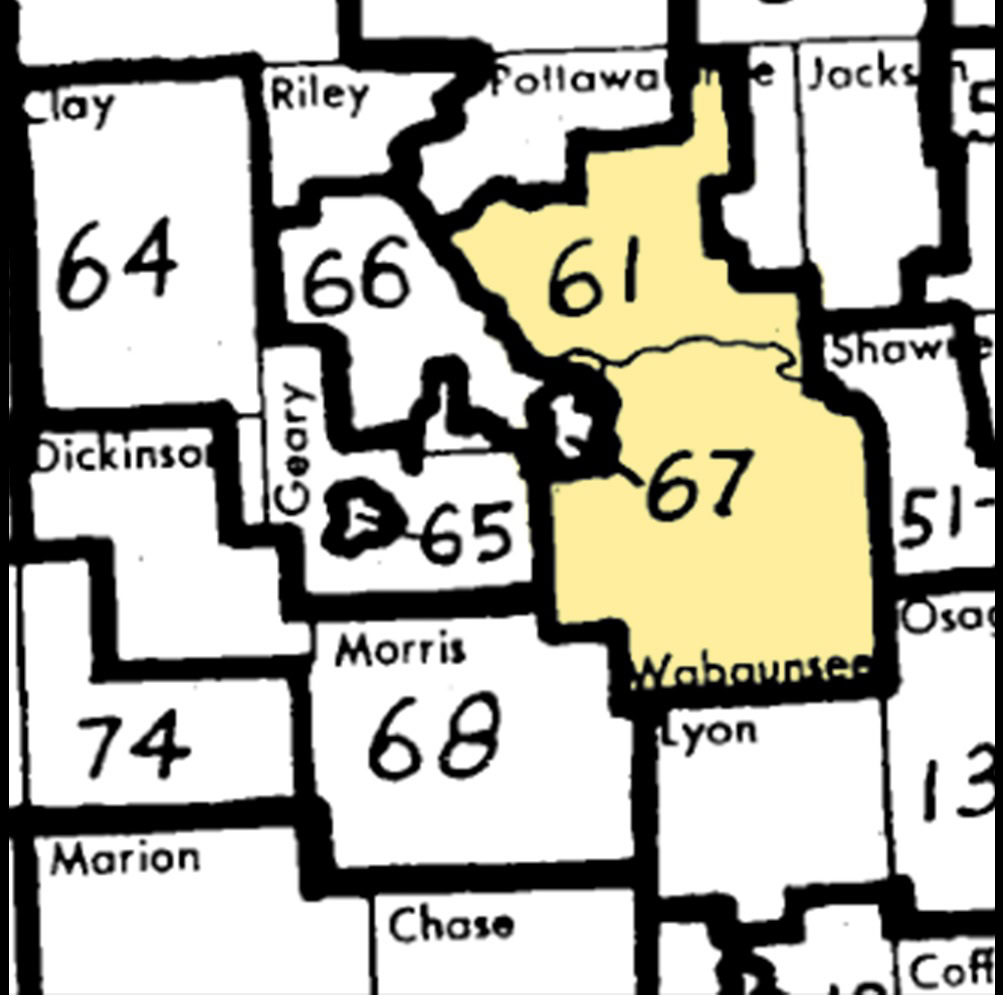
House Districts 61 + 67 Most Approximate
1982: R
DISTRICT 61: D (D 54.68% – 4,045, R 45.31% – 3,352)
DISTRICT 67: R (D 37,73% – 2,057, R 62.26% – 3,394)
COMBINED: R (D 47.49% – 6,102, R 52.50% – 6,746)
1984: R
DISTRICT 61: D (D 52.12% – 4,618, R 47.87% – 4,241)
DISTRICT 67: R (D 32.67% – 2,444, R 67.32% – 5,035)
COMBINED: R (D 43.22% – 7,062, R 56.77% – 9,276)
1986: R
DISTRICT 61: D (D 51.96% – 4,237, R 48.03% – 3,916)
DISTRICT 67: R (R 4,810)
COMBINED: R (D 32.68% – 4,237, R 67.31% – 8,726)
1988: D
DISTRICT 61: D (D 64.43% – 5,627, R 36.56% – 3,244)
DISTRICT 67: D (D 53.58% – 3,693, R 46.41% – 3,199)
COMBINED: D (D 59.12% – 9320, R 40.87% – 6443)
1990: D
DISTRICT 61: D (D 5,917)
DISTRICT 67: D (D 57.14% – 4,054, R 42.85% – 3,040)
COMBINED: D (D 76.63% – 9,971, R – 23.36% – 3,040)
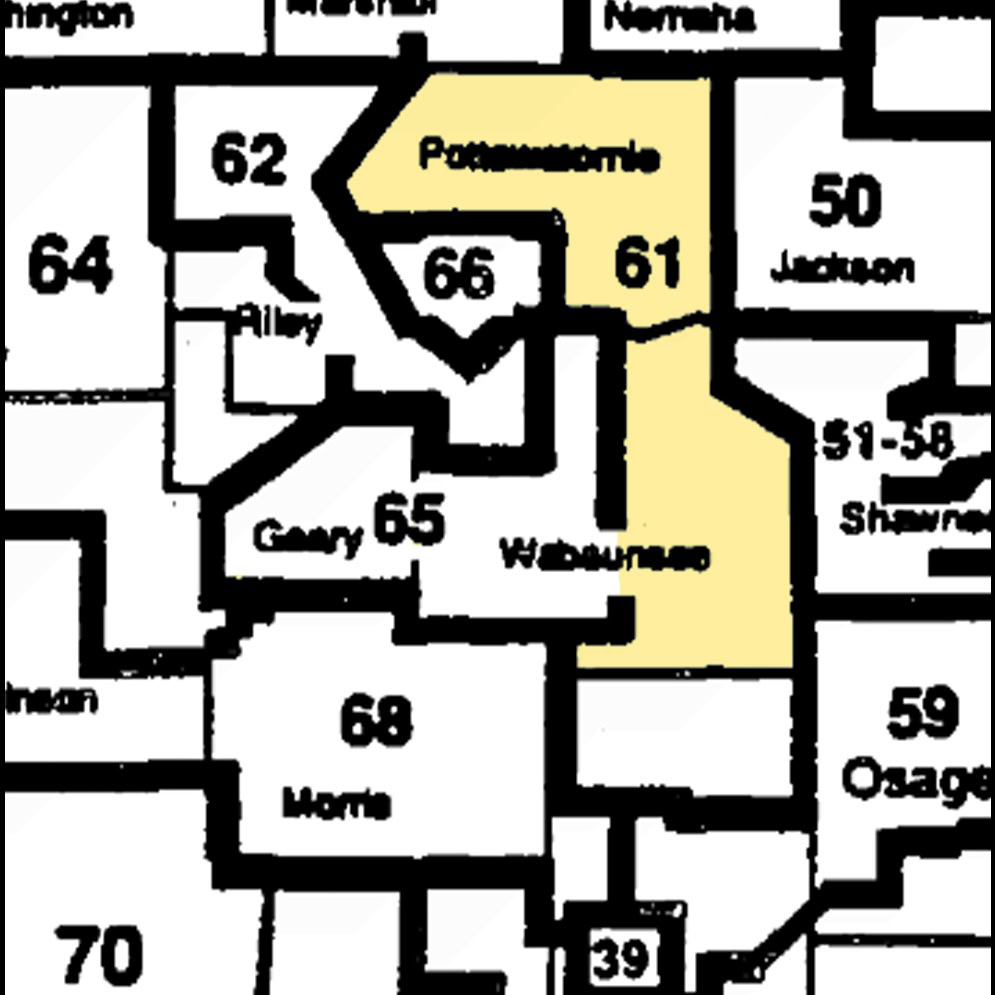
House Districts 51 + 61 Most Approximate
2002: R
DISTRICT 51: R (D 32.94% – 2,855, R 62.22% – 5,393, Reform 4.83% – 419)
DISTRICT 61: R (R 6,613)
COMBINED: R (D 18.68% – 2,855, R 78.57% – 12,006, Reform 2.74% – 419)
2004: R
DISTRICT 51: R (D 40.1% – 2,954, R 59.8% – 8,110)
DISTRICT 61: R (R 77.75% – 7,441, L 12.27% – 1,175, I 9.96% – 954)
COMBINED: R (D 14.31% – 2,954, R 75.36% – 15,551, I 4.62% – 954, L 5.69% – 1,175)
2006: R
DISTRICT 51: R (R 7,867)
DISTRICT 61: R (R 78.88% – 6,204, L 12.32% – 969, Reform 8.79% – 692)
COMBINED: R (R 89.44% – 14,071, L 6.15%, Reform 4.39%)
2008: R
DISTRICT 51: R (R 9,582)
DISTRICT 61: R (R 9,515)
COMBINED: R (R 19,097)
2010: R
DISTRICT 51: R (7,313)
DISTRICT 61: R (3,366)
COMBINED: R (10,679)
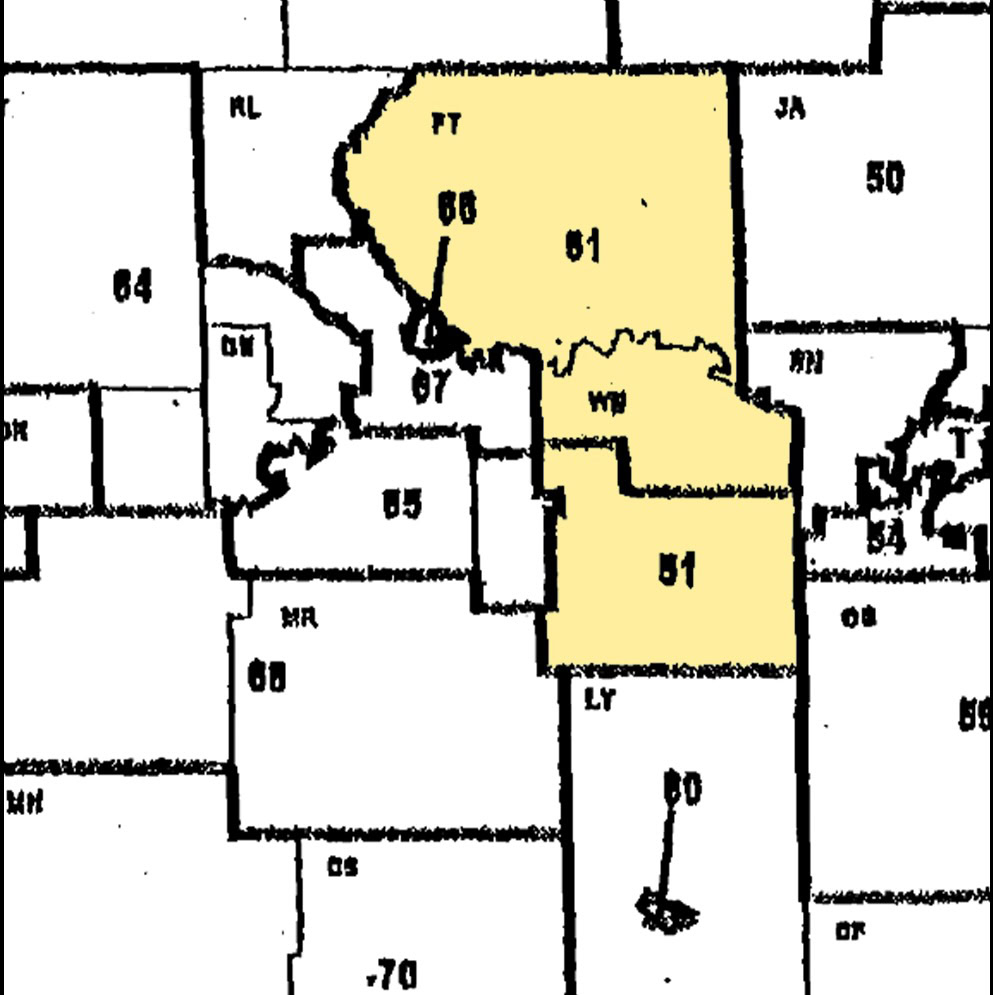
House District 51
2012: R (D 30% – 2,899, R 69.9% – 6,761) Highland
2014: R (R 7,222) Highland
2016: R (D 48.0% – 5,354, R 51.9% – 5,783)
Highland +4.25%, +429
